
Tool · Web · No installation
Kd Fitting Tool
Kd 拟合工具
Quadratic binding-model Kd fitting from concentration/signal data. Runs entirely in your browser — paste from Excel, fit, export the curve and image. Your data is never uploaded.
基于严格二次结合模型的 Kd 拟合工具。从浓度/信号数据出发,全程在浏览器本地运行:可直接粘贴 Excel 两/三列数据,一键拟合,导出曲线点位和图片。数据不上传任何服务器。
100% browser-local · 浏览器本地运行 · No account, no upload
/ Introduction · 介绍
What it does.这个工具能做什么。
Kd Fitting Tool performs nonlinear fitting on the relationship between experimental concentration X and observed signal Y, using the strict quadratic binding equation, to obtain the dissociation constant Kd that best explains the data. The fit is run twice in parallel — once with the baseline Ybase as a free parameter, and once with Ybase fixed to a user-supplied value — so you can compare both interpretations on the same dataset.
本工具使用严格的二次结合模型,对实验浓度 X 与信号 Y 之间的关系进行非线性拟合,求出最能解释数据的解离常数 Kd。每次会同时给出两组结果:一组 Ybase 作为自由参数浮动,一组 Ybase 固定为用户输入值,便于在同一份数据上比较两种解释。
Model · 模型
Y = Ybase + alpha · [AT]

[AT] = 0.5 · (X + fixed + Kd − √((X + fixed + Kd)² − 4 · X · fixed))

X      = total concentration of the variable component  ·  可变一方总浓度
fixed  = total concentration of the fixed component     ·  另一方固定总浓度
Kd     = dissociation constant                          ·  解离常数
Y free fit — Ybase is fitted as a free parameter; the background floats for the best overall fit. Y free 拟合:Ybase 作为自由参数参与拟合,允许背景浮动。
Y fixed fit — Ybase is held at the value you enter; useful when the baseline is independently known. Y fixed 拟合:Ybase 固定为输入值,适用于背景信号已知的情况。
-
Strict quadratic model
严格二次结合模型
Uses the full binding equation rather than a simplified hyperbolic approximation — accurate even when ligand depletion matters.
使用完整二次结合方程,而非简化的双曲近似。在结合物浓度接近 Kd 时仍然准确。
-
Paste from Excel
Excel 直接粘贴
Spreadsheet-style table accepts 2- or 3-column paste (X, Y, optional Var(Y)). Replicate mode auto-computes error bars from
n ≥ 2replicates per X.表格支持两列或三列直接粘贴(X、Y、可选 Var(Y))。重复模式下,工具会按 X 自动统计
n ≥ 2组重复并计算误差棒。 -
Error bars, two ways
两种误差棒模式
Manual variance column or replicate-based sample variance — both render error bars on the fitted curve and propagate into the displayed metrics.
手动输入方差,或从 n 组重复数据自动计算样本方差。两种方式都会在拟合曲线上画出误差棒。
-
Export curve & image
导出曲线与图片
Export the fitted curve as CSV (default 1000 sampled points), or as a PNG / JPG at your chosen PPI for slides and figures.
可将拟合曲线导出为 CSV(默认 1000 个取样点),或按指定 PPI 导出 PNG / JPG,方便插入幻灯片或文章。
-
Side-by-side fit results
两组结果并排显示
Both Y-free and Y-fixed fits run on every click — see Kd, Ybase, alpha, and goodness metrics side by side instead of toggling modes.
每次拟合都会同时给出 Ybase 自由与固定两组结果(Kd、Ybase、alpha 与拟合优度),不需要来回切换。
-
Browser-only, zero install
浏览器原生,零安装
Pure HTML/JS — no plugin, no upload, no account. Works offline once the page is loaded.
纯 HTML/JS 实现,不需要插件、不需要账号、不上传数据。页面加载后可离线使用。
/ Usage · 使用方式
How to use it.使用流程。
Open the tool, paste your data, click Fit. Sample data is loaded by default so you can verify the workflow before entering your own measurements.
打开工具,粘贴数据,点 Fit。页面默认载入了一组示例数据,方便先跑通流程再换上自己的实验值。
-
01
Open the tool
打开工具
Click Launch Kd Fitting Tool at the top of this page — it opens in a new tab. The page is self-contained: bookmark it, save it offline, or even open the local HTML file directly.
点击页面顶部的 Launch Kd Fitting Tool,工具在新标签页打开。页面是自包含的,可以收藏、离线保存,或直接打开本地 HTML 文件。
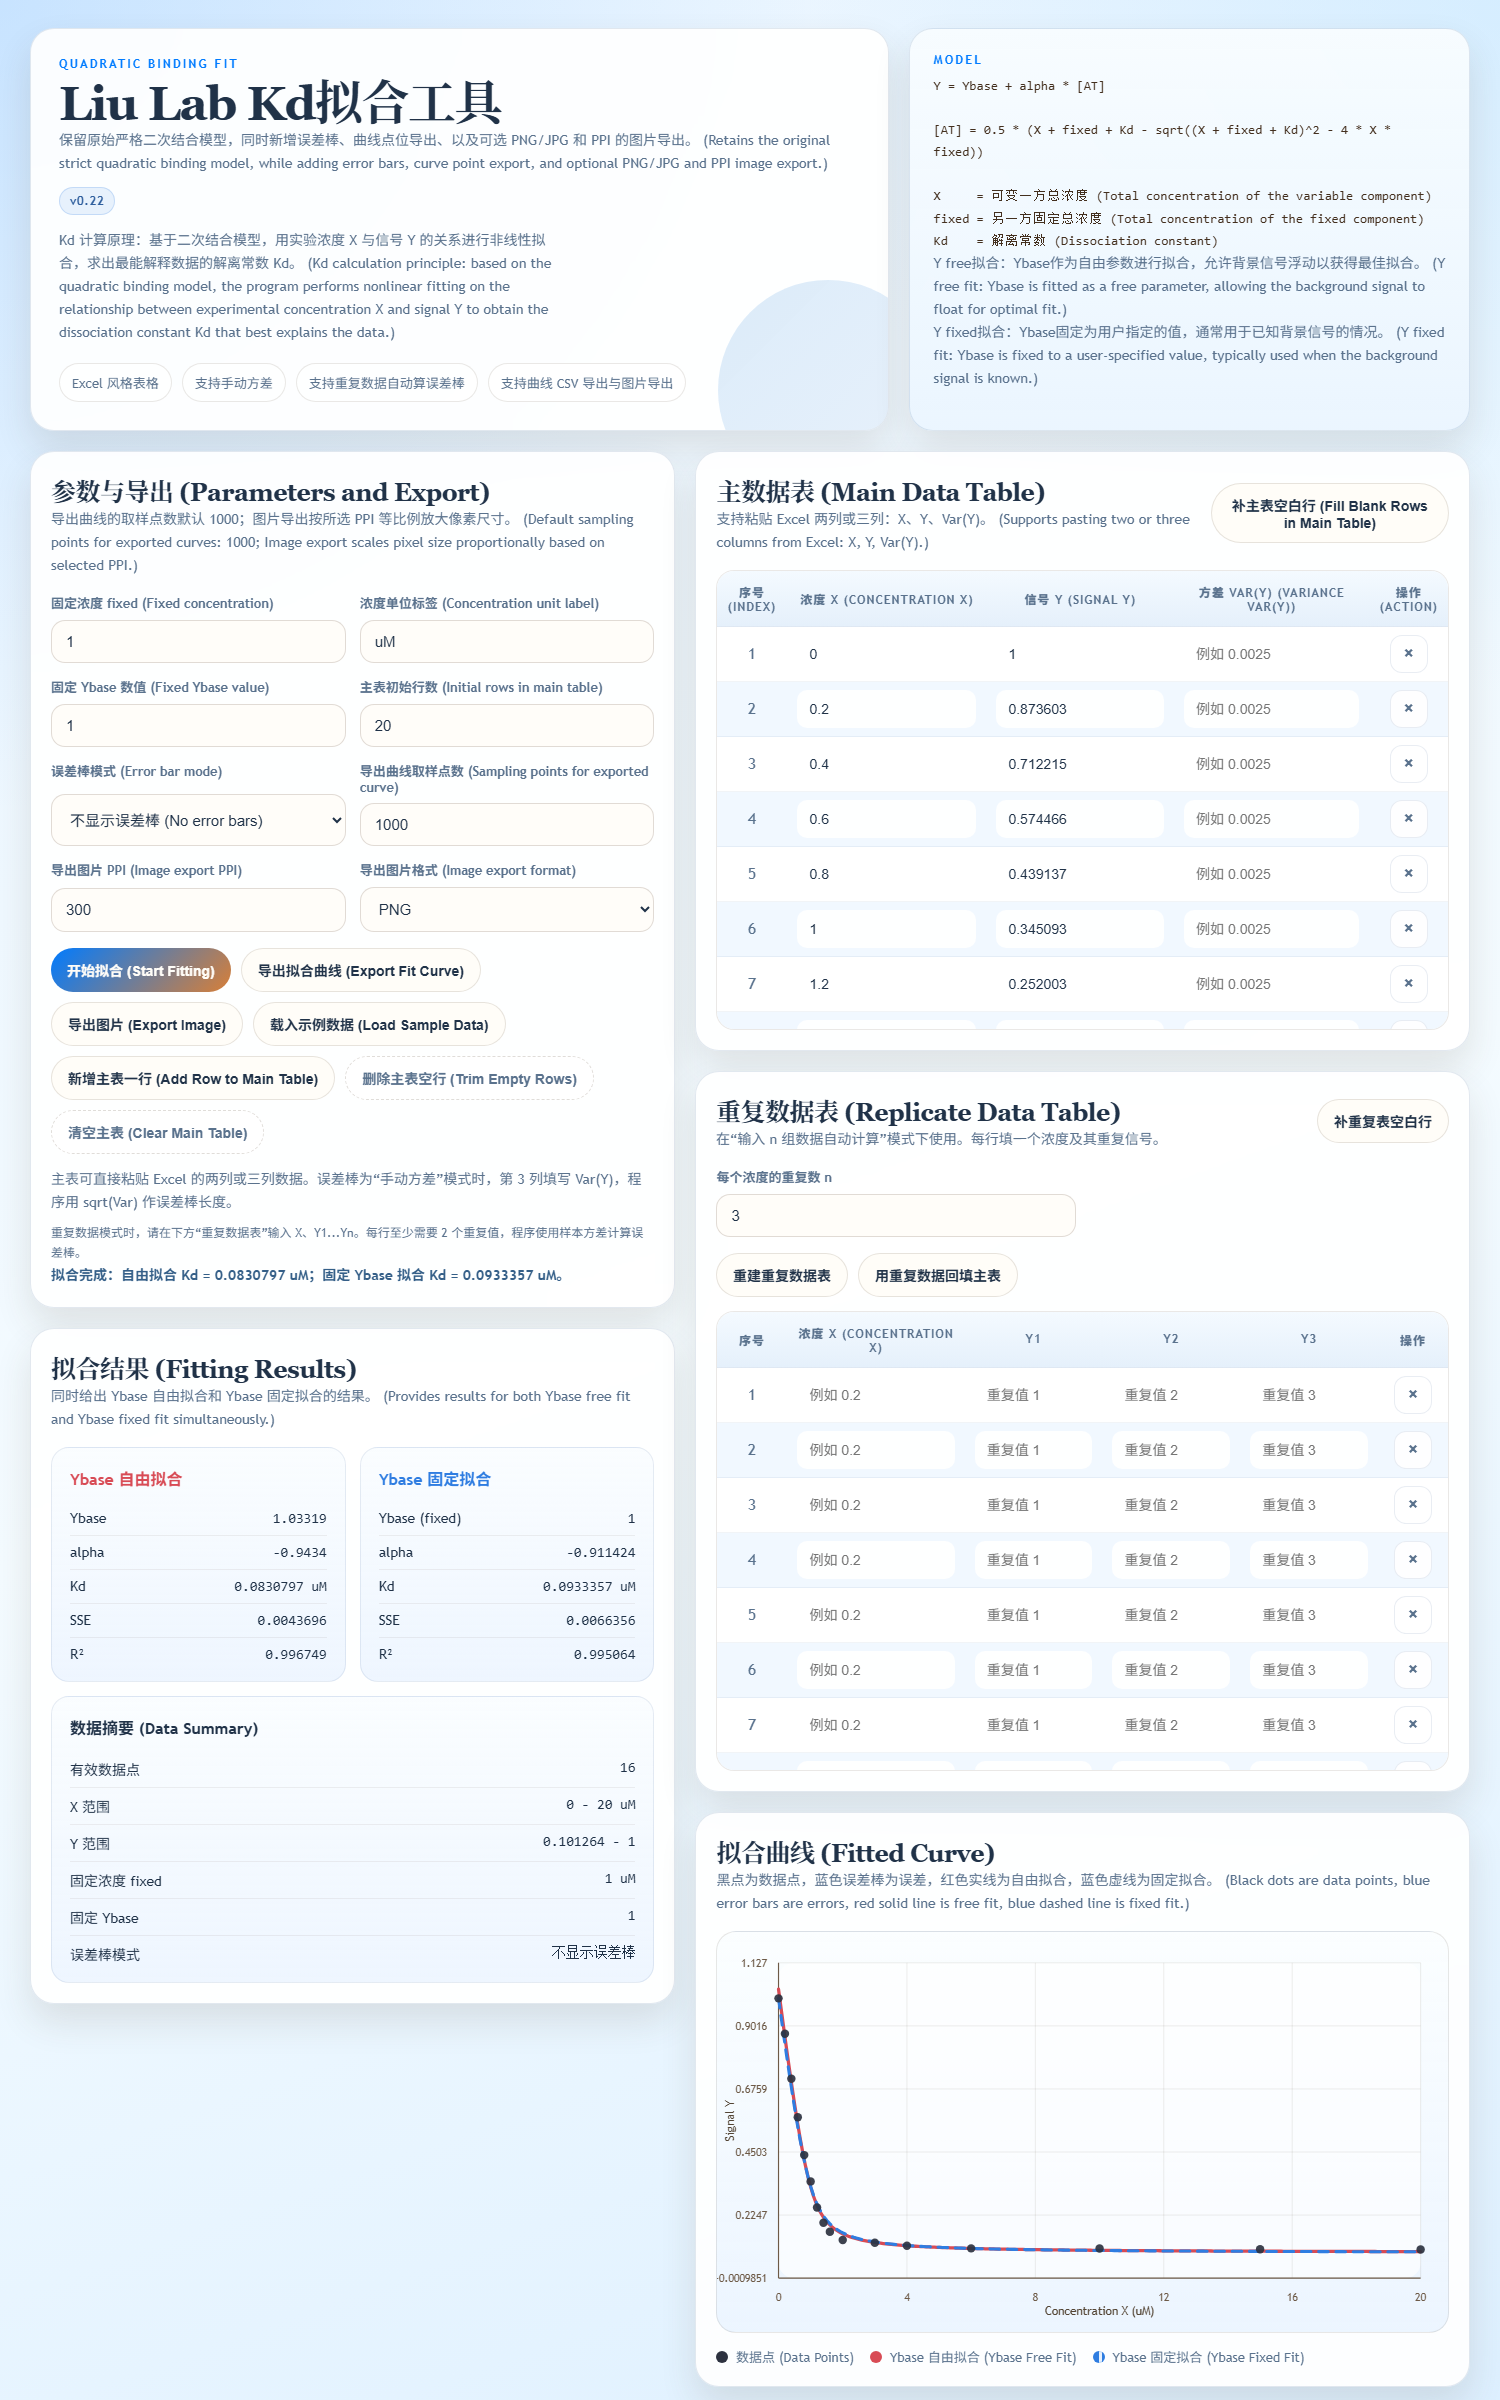
Fig. 01 — Main view · 工具主界面 -
02
Enter parameters
设置参数
In the Parameters and Export panel, set
Fixed concentration(the constant component's total concentration), the unit label (defaultuM), the fixedYbasevalue, and the error-bar mode:None,Manual variance, orAuto from n replicates.在「参数与导出」面板里设置:
Fixed concentration(固定一方总浓度)、浓度单位(默认uM)、固定Ybase数值,以及误差棒模式(不显示 / 手动方差 / 重复数据自动计算)。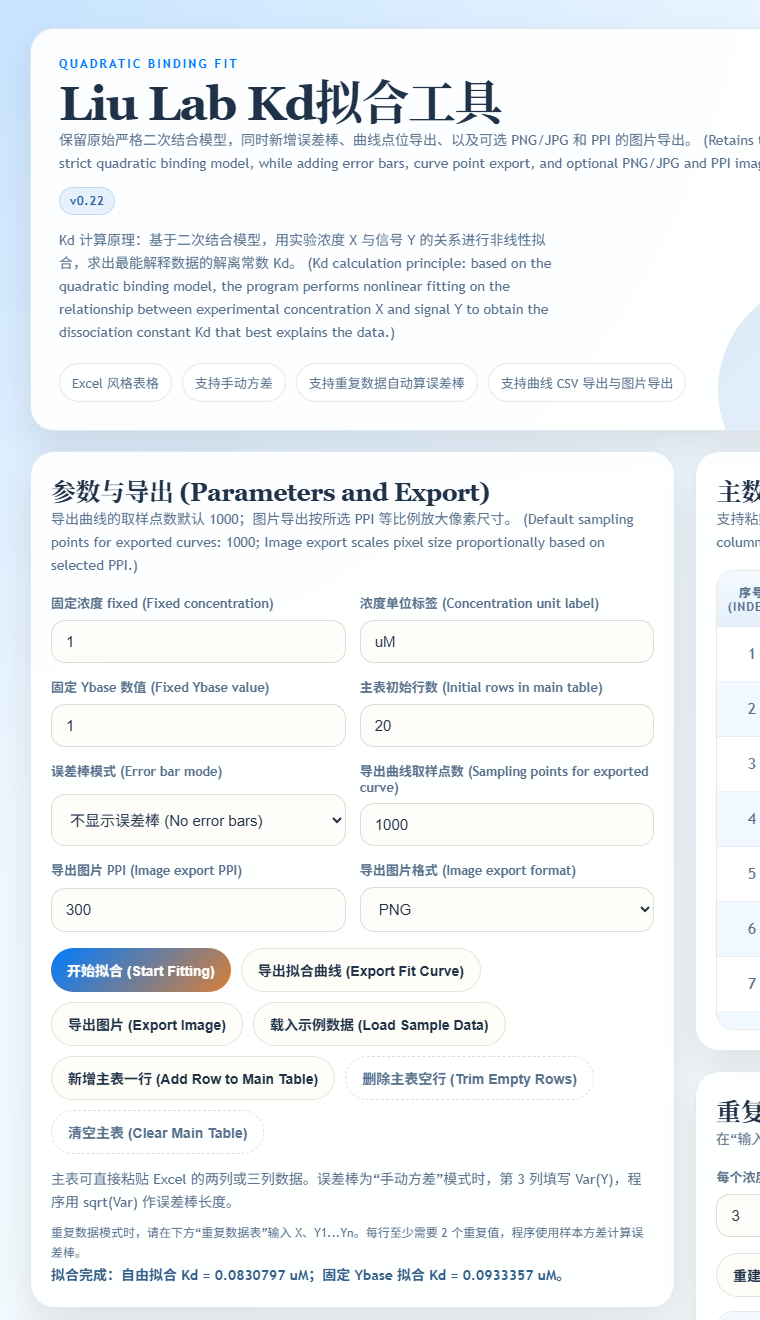
Fig. 02 — Parameter panel · 参数面板 -
03
Paste your data
粘贴数据
In the Main Data Table, paste 2 or 3 columns directly from Excel:
X,Y, and optionallyVar(Y). For replicate-mode error bars, use the lower Replicate Data Table and enterX, Y₁, Y₂, ...— the program needs at least 2 values per X.在「主数据表」中直接粘贴 Excel 两列或三列数据:
X、Y、可选Var(Y)。如果用重复模式做误差棒,请改用下方「重复数据表」按X, Y₁, Y₂, ...输入;每个 X 至少要 2 个重复值。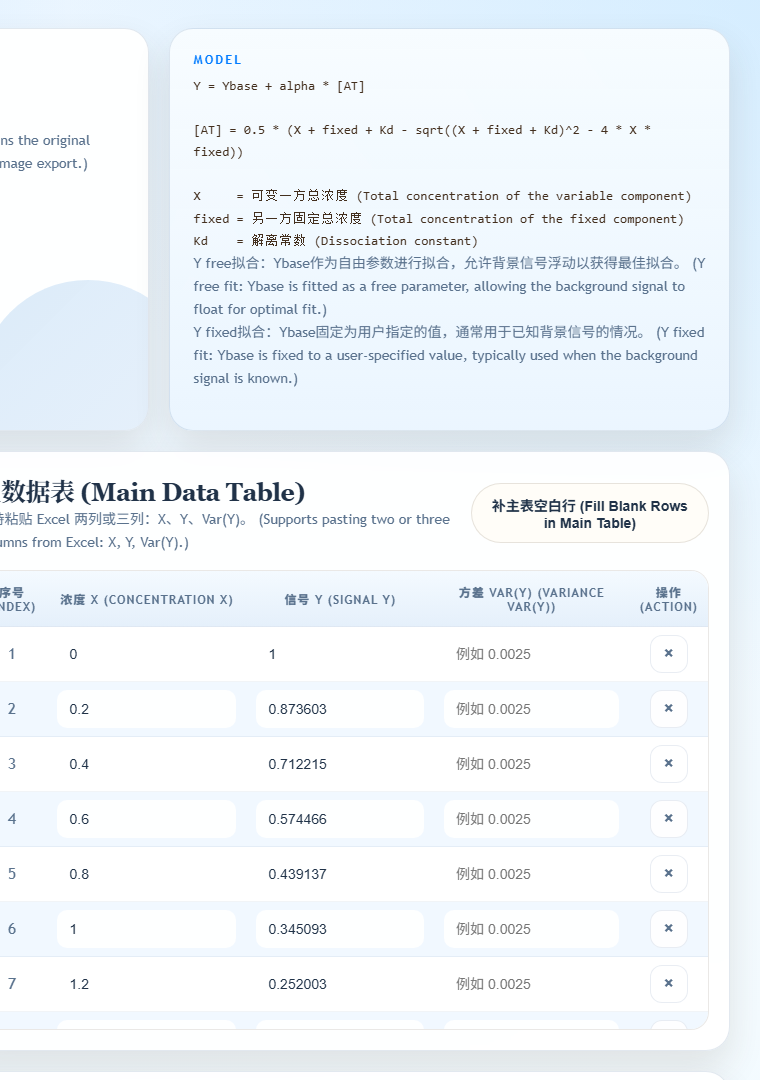
Fig. 03 — Main data table · 主数据表 -
04
Fit & export
拟合并导出
Click Start Fitting. The results panel shows Y-free and Y-fixed fits side by side with Kd,
Ybase,alpha, and goodness metrics. The fitted curve appears with your data points; export it as CSV (default 1000 sampled points) or as PNG / JPG at your chosen PPI.点击「开始拟合」。结果面板会并排显示 Y 自由与 Y 固定两组拟合(Kd、
Ybase、alpha与拟合优度)。拟合曲线与数据点同时绘制,可按需导出为 CSV(默认 1000 个取样点)或指定 PPI 的 PNG / JPG 图片。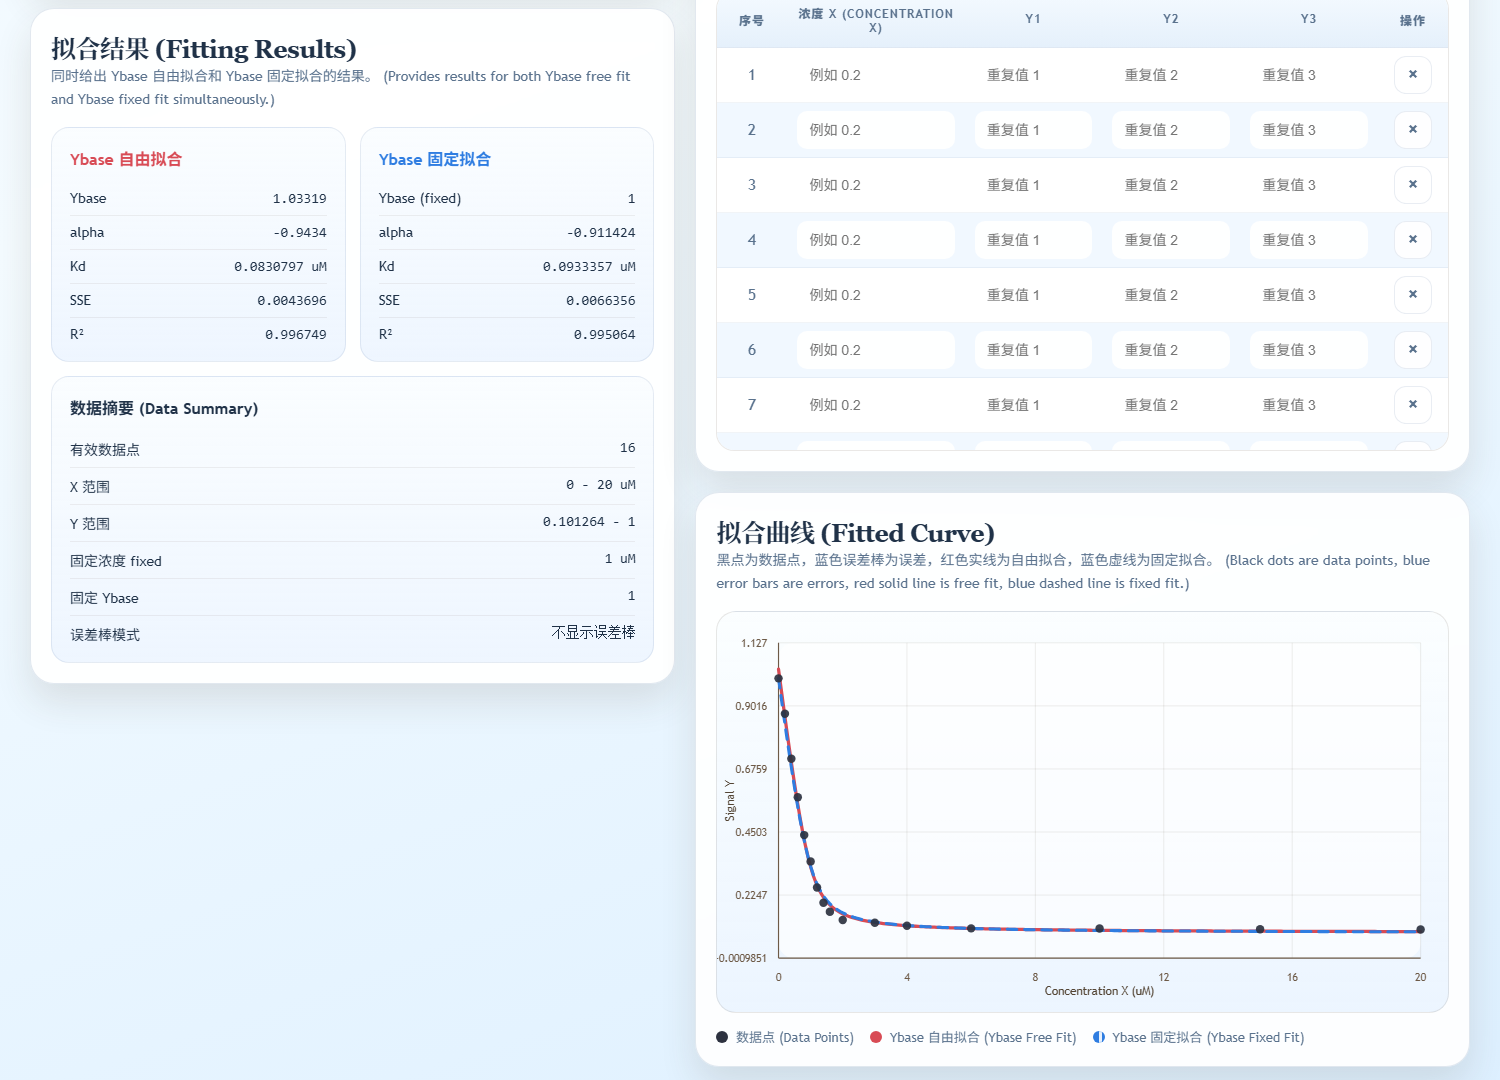
Fig. 04 — Fit result & curve · 拟合结果与曲线
/ Disclaimer · 声明
Things to know.使用前请阅读。
-
Your data never leaves the browser.
数据全程在浏览器本地
All computation — paste handling, fitting, curve sampling, image rendering — runs in client-side JavaScript. Nothing is uploaded; the page does not call any backend.
所有处理(粘贴、拟合、曲线采样、图片渲染)全部在浏览器端的 JavaScript 中完成。不上传任何数据,页面也不调用任何后端服务。
-
Works offline once loaded.
加载后可离线使用
The page is fully self-contained: no external scripts, no CDN. After the page loads once, you can disconnect from the network and keep using it. Save the HTML file locally for permanent offline access.
页面是自包含的,不依赖任何外部脚本或 CDN。首次加载后即可断网继续使用,也可将 HTML 文件保存到本地永久离线使用。
-
Free for academic / non-commercial use.
学术与非商业用途免费
Kd Fitting Tool is provided free for academic research and teaching. For commercial integration or redistribution, contact the author in advance.
本工具面向学术研究与教学免费使用。如需用于商业产品集成或二次分发,请提前联系作者。
-
Provided as-is, without warranty.
不提供任何形式的担保
Fits are best-effort and depend on data quality. Validate critical results with independent fits (GraphPad, Origin, custom Python) and consider biological/experimental context. Bug reports: [email protected].
拟合结果尽力而为,受限于数据质量。关键结论请用其他工具(GraphPad、Origin、自写 Python 等)独立复核,并结合实验背景判断。Bug 与建议请发到 [email protected]。
-
Cite if used in publications.
论文使用请引用
If this tool contributed to a published study, please cite: Zhang X. Kd Fitting Tool, v0.22, Liu Lab, University of Waterloo, 2026. zxiaohan.com/research/tools/kd-fit.
若本工具对已发表的研究有帮助,烦请按上述格式引用。
/ Acknowledgments · 致谢
Built with the lab.和实验室一起完成。
Developed in the Bionanotechnology & Interfaces Laboratory at the University of Waterloo, led by Prof. Juewen Liu. The tool grew out of routine Kd-fitting needs across the group's aptamer / DNAzyme / nanomaterial-binding projects — a thin, accurate, offline-safe alternative to spreadsheet macros and proprietary fitting software.
本工具在加拿大滑铁卢大学刘珏文教授课题组(Bionanotechnology & Interfaces Laboratory)完成。源于组内适配体 / DNA 酶 / 纳米材料结合实验中日常的 Kd 拟合需求——一个轻量、准确、可离线使用的替代品,避免依赖电子表格宏或商业拟合软件。
-

Prof. Juewen Liu
Advisor · 导师
Professor of Chemistry at the University of Waterloo, College member of the Royal Society of Canada (RSC), and Tier 1 Canada Research Chair in Biosensors & Bionanotechnology. Group lead for the aptamer / DNAzyme / nanomaterial research that motivates this tool.
-
Yuanli Li
Formula development & research · 公式开发与研究
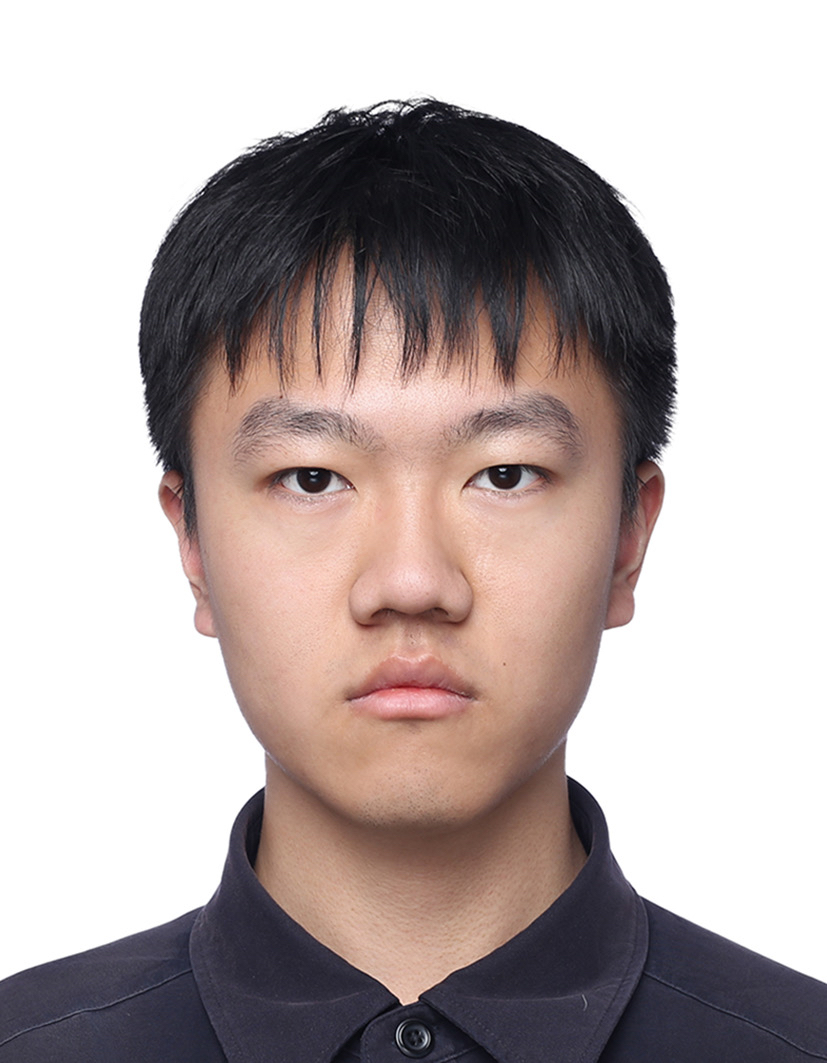
Third-year undergraduate in the Materials Nanoscience joint program (Beijing Jiaotong University × University of Waterloo). Derived and validated the quadratic-binding fit, the Y-free / Y-fixed parameterization, and the replicate-mode variance handling.
-

Xiaohan Zhang
Web build, visualization & QA · 网页适配、可视化与测试
Postdoctoral researcher at the University of Waterloo under Prof. Juewen Liu. Turned the fitting model into a self-contained browser tool — UI, plotting, paste-from-Excel, CSV / PNG export — and ran the cross-dataset QA.
Special thanks to Prof. Bing Jin for guidance and discussion on the binding model.
特别感谢 金冰教授 在结合模型上提供的指导与讨论。
/ FAQ · 常见问题
Questions people actually ask.使用者真正会问的问题。
Worked example · 算例
A fluorescence titration of a fixed 50 nM labelled aptamer against increasing
target concentration. Enter fixed = 50 (nM), paste the two columns below as
X, Y, and fit.
固定 50 nM 标记适配体、滴加递增浓度靶标的荧光滴定。填入
fixed = 50(nM),把下面两列按 X, Y 粘贴进表格,然后拟合。
| X · [target] (nM) | Y · signal (a.u.) |
|---|---|
| 0 | 1020 |
| 10 | 1180 |
| 25 | 1395 |
| 50 | 1660 |
| 100 | 2010 |
| 200 | 2360 |
| 400 | 2600 |
| 800 | 2730 |
Because the fixed component is 50 nM and the fitted Kd lands in the same tens-of-nanomolar range, a hyperbolic fit of this dataset would be biased — the free target concentration is measurably lower than the added concentration across the lower half of the series. This is exactly the regime the quadratic model exists for.
由于固定一方是 50 nM,而拟合出的 Kd 也落在几十纳摩尔量级, 对这份数据做双曲拟合会有系统偏差——在序列的下半段,游离靶标浓度明显低于加入浓度。 这正是二次模型存在的意义所在。
-
Why a strict quadratic model instead of a hyperbolic fit?
为什么用严格二次模型,而不是双曲拟合?
The hyperbolic (Langmuir) form assumes free ligand concentration equals total added concentration. That assumption breaks down once the fixed component's concentration approaches Kd — a regime routine aptamer titrations often sit in. The quadratic equation solves for bound complex explicitly and stays correct under ligand depletion.
双曲(Langmuir)形式假设游离配体浓度等于加入的总浓度。一旦固定一方的浓度接近 Kd,这个假设就不成立——而适配体滴定实验经常正好落在这个区间。二次方程直接解出结合复合物浓度,在存在配体消耗时仍然准确。
-
Which component should I enter as X, and which as fixed?
哪一方填 X,哪一方填 fixed?
X is the component you titrate — the one whose concentration varies across your data rows. fixed is the total concentration of the component held constant in every well or cuvette. The model is symmetric in the two binding partners, so the assignment follows your experiment, not the chemistry.
X 是你滴定的那一方,即在数据各行中浓度变化的组分;fixed 是每个孔或比色皿中保持恒定的那一方的总浓度。模型对两个结合方是对称的,所以怎么分配取决于你的实验设计,而不是化学性质。
-
Should I report the free-Ybase fit or the fixed-Ybase fit?
该报告 Ybase 自由拟合还是固定拟合的结果?
Report the fixed-Ybase fit when you have independently measured the background — a buffer-only blank, for example. Use the free fit when the baseline is genuinely unknown. The tool runs both on the same dataset precisely so you can see how much the Kd estimate depends on that choice; a large gap between the two is itself a signal that the data underdetermine the baseline.
如果背景信号是独立测得的(例如只有缓冲液的空白对照),报告 Ybase 固定拟合的结果;如果基线确实未知,用自由拟合。工具在同一份数据上同时跑两组,正是为了让你看到 Kd 估计对这个选择有多敏感——两者差距很大本身就说明数据不足以确定基线。
-
How many replicates do I need for error bars?
误差棒需要多少组重复?
Replicate mode computes sample variance from n ≥ 2 replicates at the same X value. Two replicates will produce error bars, but the variance estimate from n = 2 is very noisy; three or more per concentration gives a bar you can actually interpret.
重复模式会对同一个 X 值下 n ≥ 2 组重复计算样本方差。两组就能画出误差棒,但 n = 2 的方差估计噪声很大;每个浓度三组以上,误差棒才真正有解释价值。
-
Is my data uploaded anywhere?
我的数据会被上传吗?
No. Paste handling, fitting, curve sampling and image rendering all run in client-side JavaScript. The page calls no backend, and once it has loaded you can disconnect from the network and keep working.
不会。粘贴处理、拟合、曲线采样和图片渲染全部在浏览器端 JavaScript 中完成。页面不调用任何后端;首次加载后可以断网继续使用。
/ Citation · 引用
How to cite.如何引用。
If this tool contributed to work you are publishing, a citation is the most useful thing you can send back — it is what keeps the tool maintained and lets other people find it.
如果这个工具对你发表的工作有帮助,引用是最有用的回馈——它既是工具能持续维护的理由,也是别人找到它的途径。
APA
Zhang, X. (2026). Kd Fitting Tool (Version 0.22) [Computer software]. https://zxiaohan.com/research/tools/kd-fit/
BibTeX
@software{zhang_kd_fit_2026,
  author  = {Zhang, Xiaohan},
  title   = {Kd Fitting Tool},
  year    = {2026},
  version = {0.22},
  url     = {https://zxiaohan.com/research/tools/kd-fit/}
}
/ Also in the toolkit · 工具集
Other tools.同系列工具。
 Desktop · Windows + macOS
Aptamer Analysis Tool
适配体序列分析工具
SELEX FASTQ trim, family clustering, and PDF / PNG / XLSX / Word reports.
 Desktop · Windows · Single-file
AptaFold
适配体二级结构预测
DNA aptamer folding with Na⁺ / Mg²⁺ / K⁺ / Ca²⁺ / temperature inputs and G-quadruplex detection.
 Desktop · Windows · Experimental
Structural Family Classification
结构家族分类
Group SELEX aptamers by loop-region structure with a self-written motif-block classifier. Experimental preview.